Introduction to PrivateEyePi Monitoring and Control System
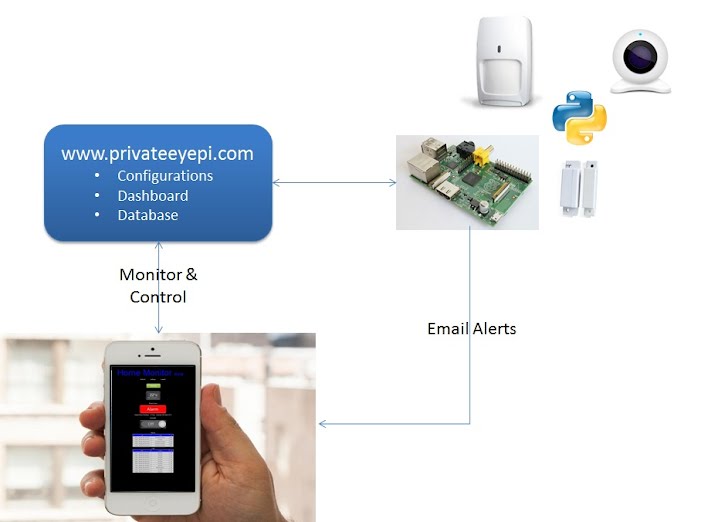
JemRF offers a general purpose monitoring services fully extensible for the home user and software developer. The PrivateEyePi server provides simple sensor monitoring as well as interacts with your local Raspberry Pi applications for near real time alerts and control actions.
Our goal is to stimulate interest in home and DIY electronics that could lead to great projects or new career opportunities. We want to help those interested in learning electronics with working examples from how to make a temperature sensor, to how to build a home alarm system.
The PrivateEyePi server is to support the different DIY learning tools provided by our JemRF Projects Website. There are no charges for monitoring or testing the alarm system or any of the projects.
The Features of the PrivateEyePi Server are shown here:
Using PrivateEyePi (PEP) Server
If you do not have an account and want one, Click Here To create and account.
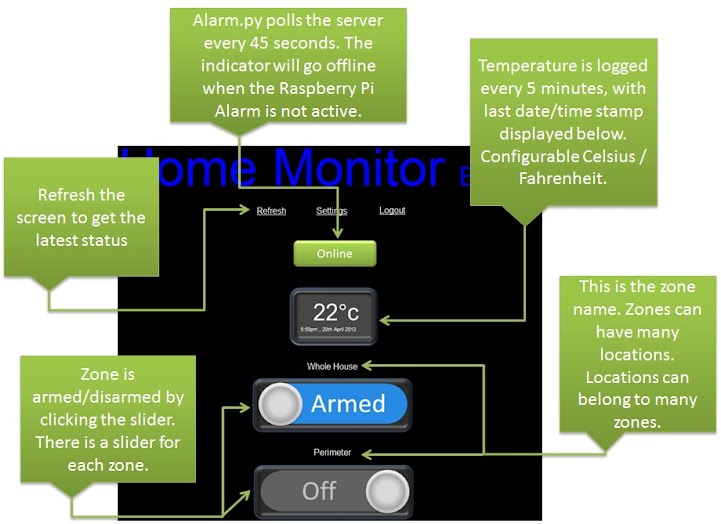
Dashboard
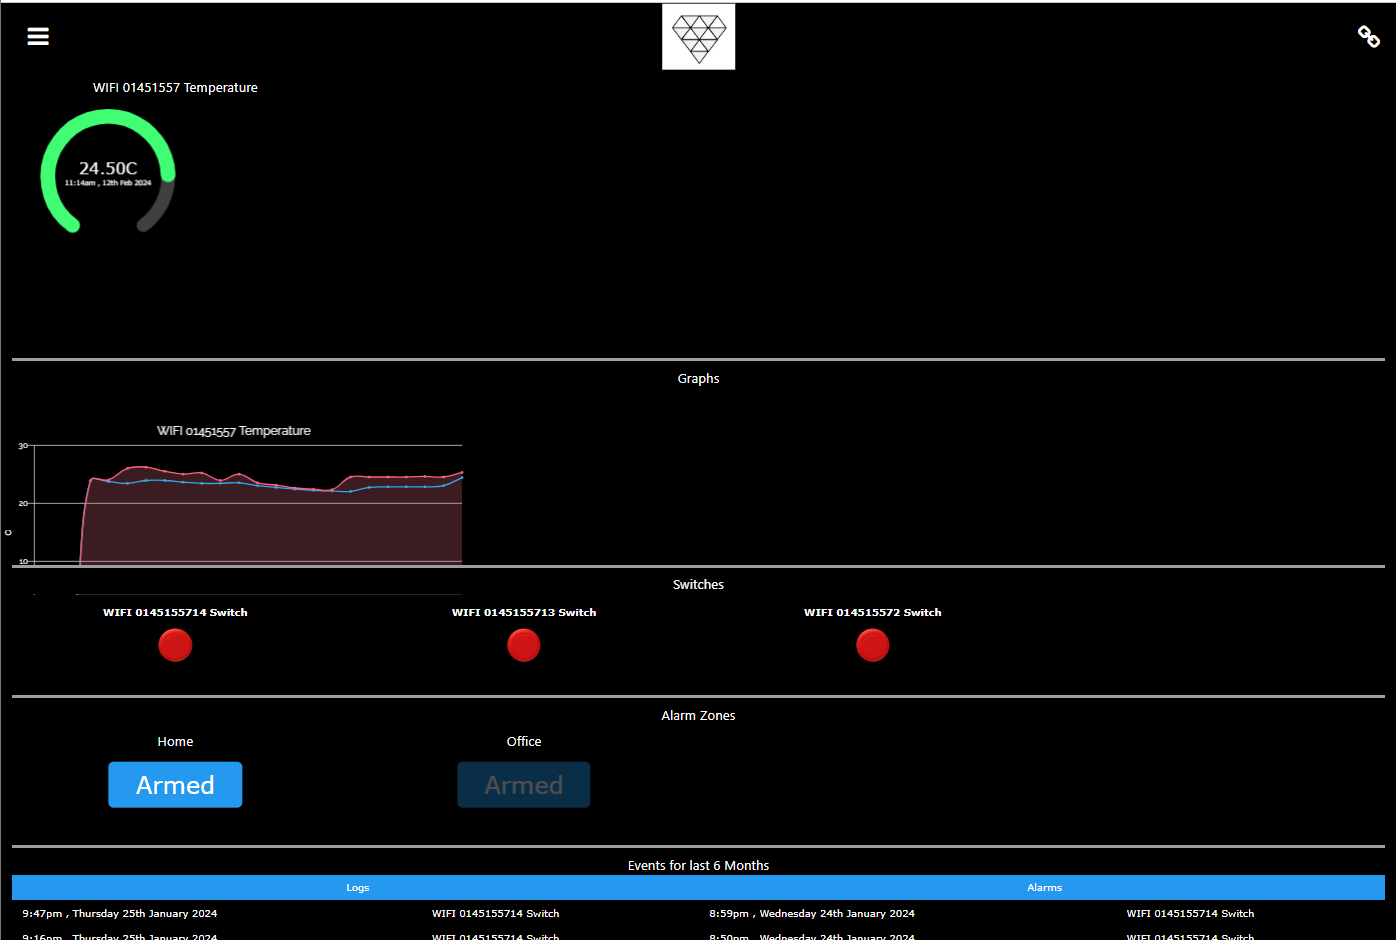
Once logged the PrivateEyePi (PEP) Dashboard is the center of all activity. From the dashboard you can monitor the status of sensors and view temperature and humidity readings in real time from The Internet. The dashboard is in 5 sections:
- The top is the graphic for the sensor being monitored
- Are Graphs of the sensor values over list 24 hours
- Are where on/off devices such as Switches are show as buttons Red Off and Green ON.
- Is teh list of Alarm Zones you defined. Here you can enable or disable a Zone.
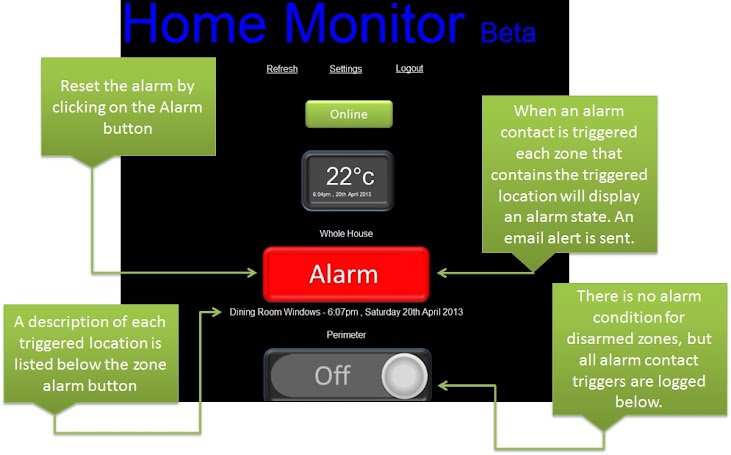
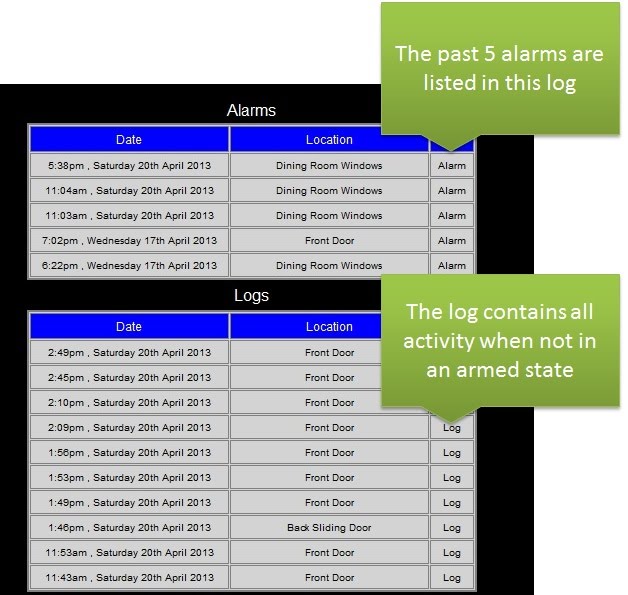
- This is the Event section with Log Events on the left and Alarm Events on the right. The events are limited to Events in the last 6 months.
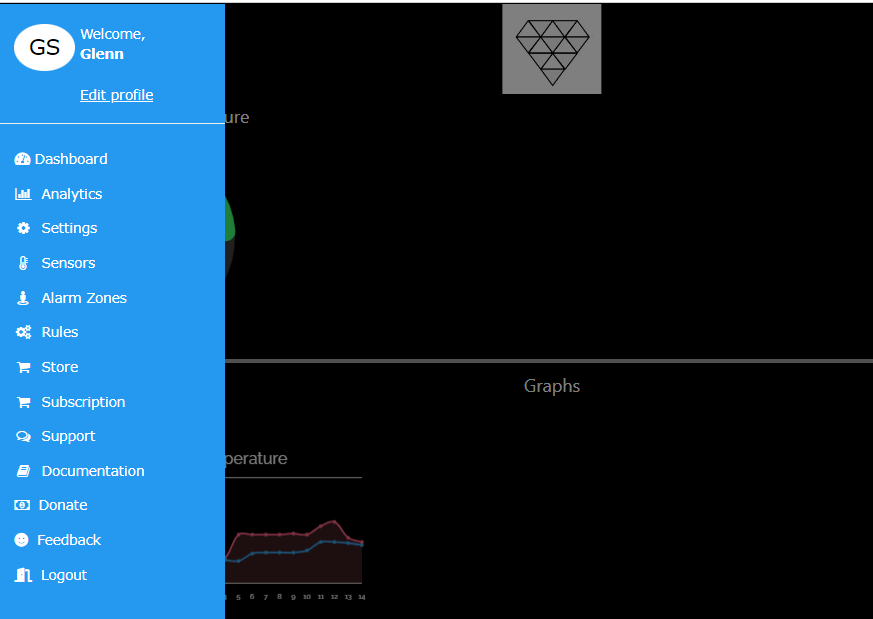
On the left side is the menu icon. Clicking on the Menu Icon presents this list of options:
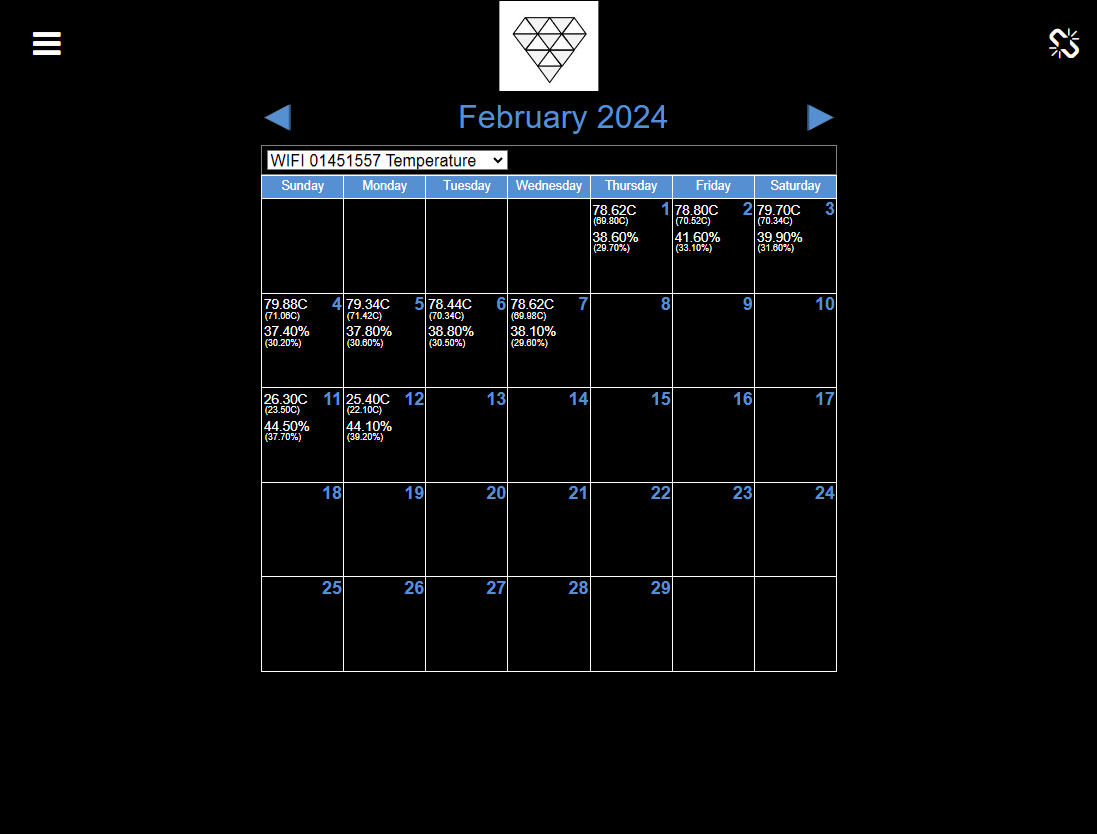
Data analysis (Analytics)
PrivateEyePi Analytics provides you an historical view of information. You can see trends using our daily, hourly and detailed data views. The Analytics tab show the received data by date and by sensor:
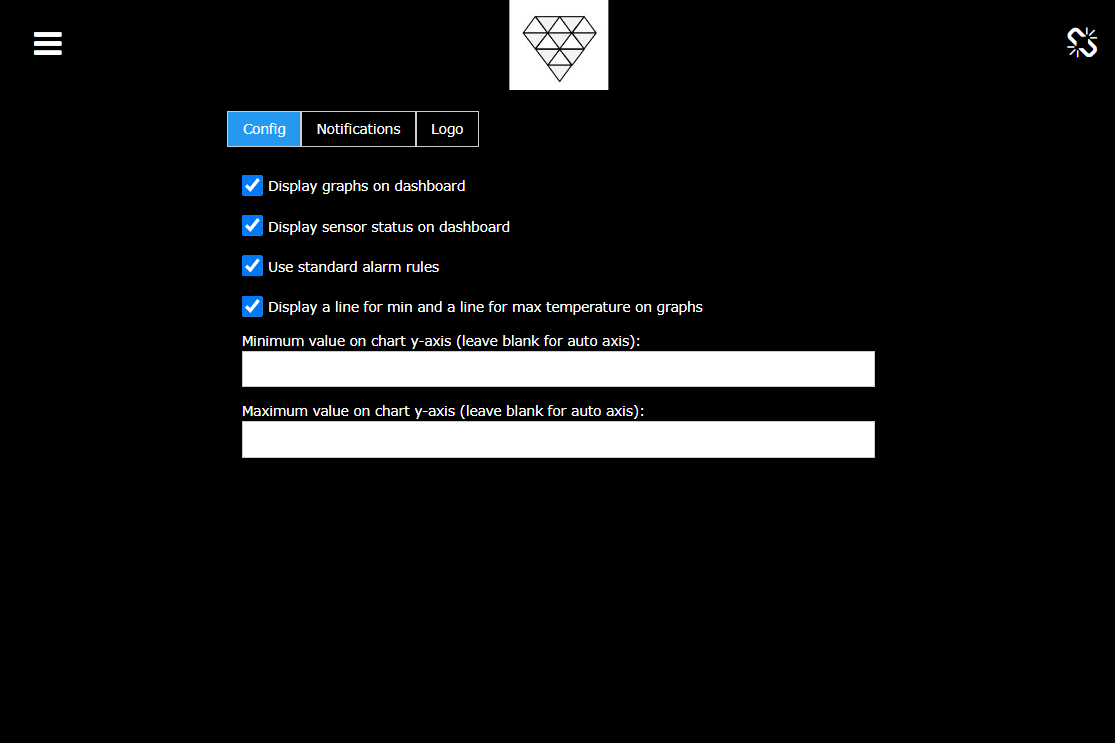
Settings
The settings page allows for user customization of their dashboard. Such as graphics, sensor status and limits on charts.
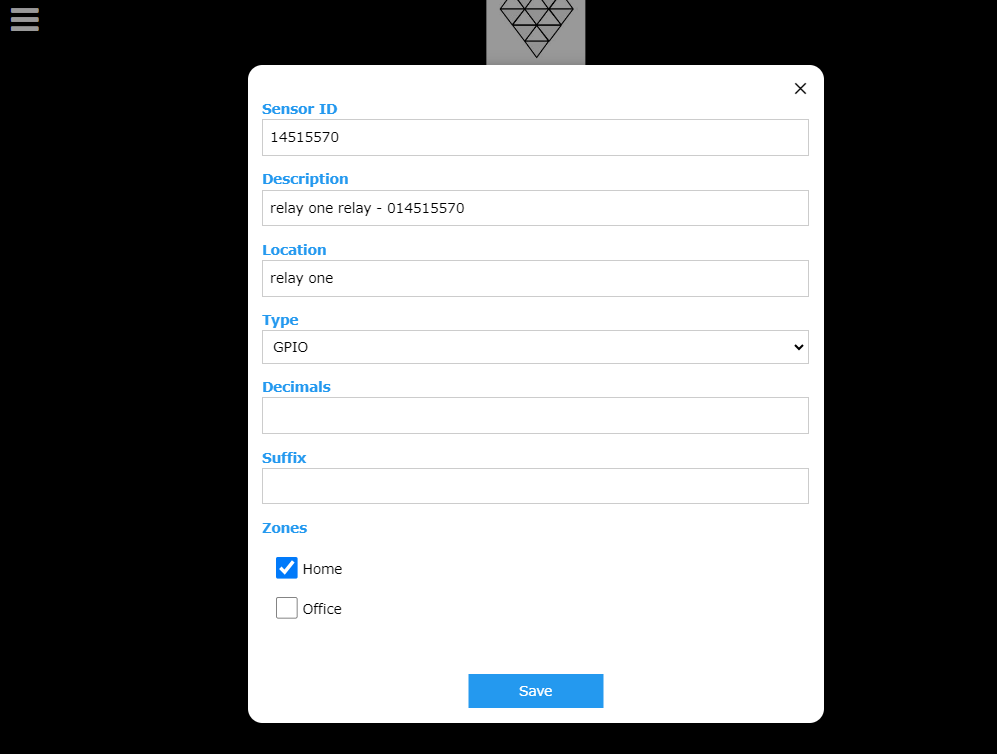
Sensor List
This provides a list of all sensors in your account.

As seen in the Sensor Edit Screen, you can change the description, location, type, how many decimals to be displayed, the Suffix (example: F, C, %) and the Zone it is in.
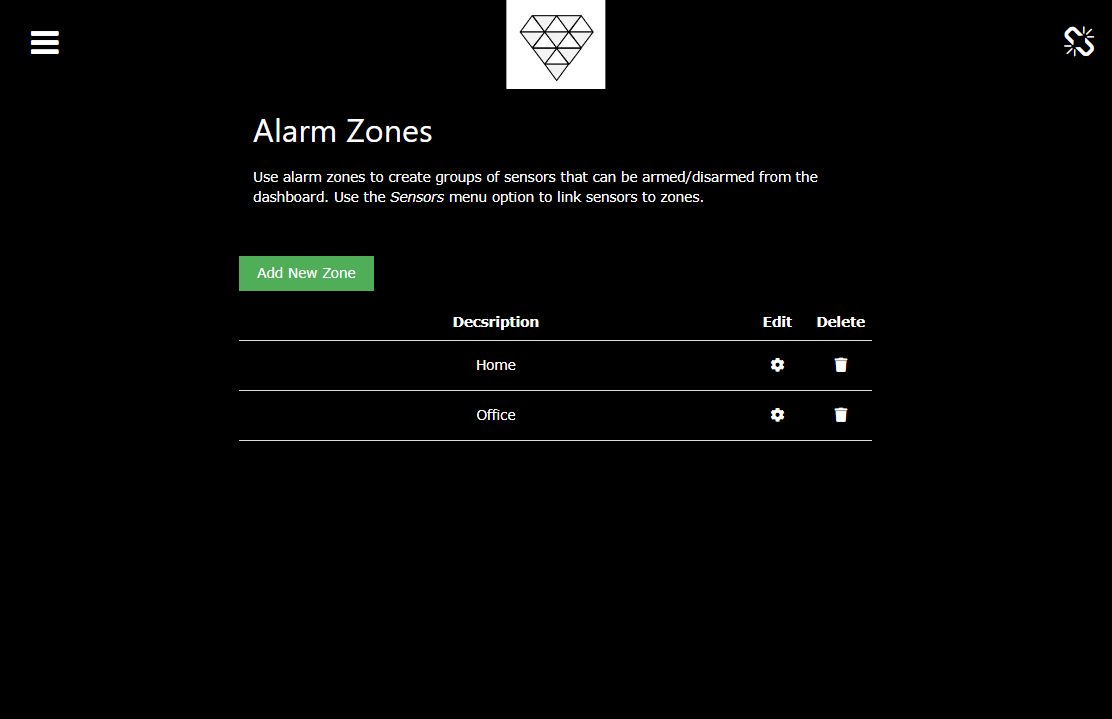
Alarm Zones
You can create zones for sensors or alarms. A zone can be enabled and disabled by rules.
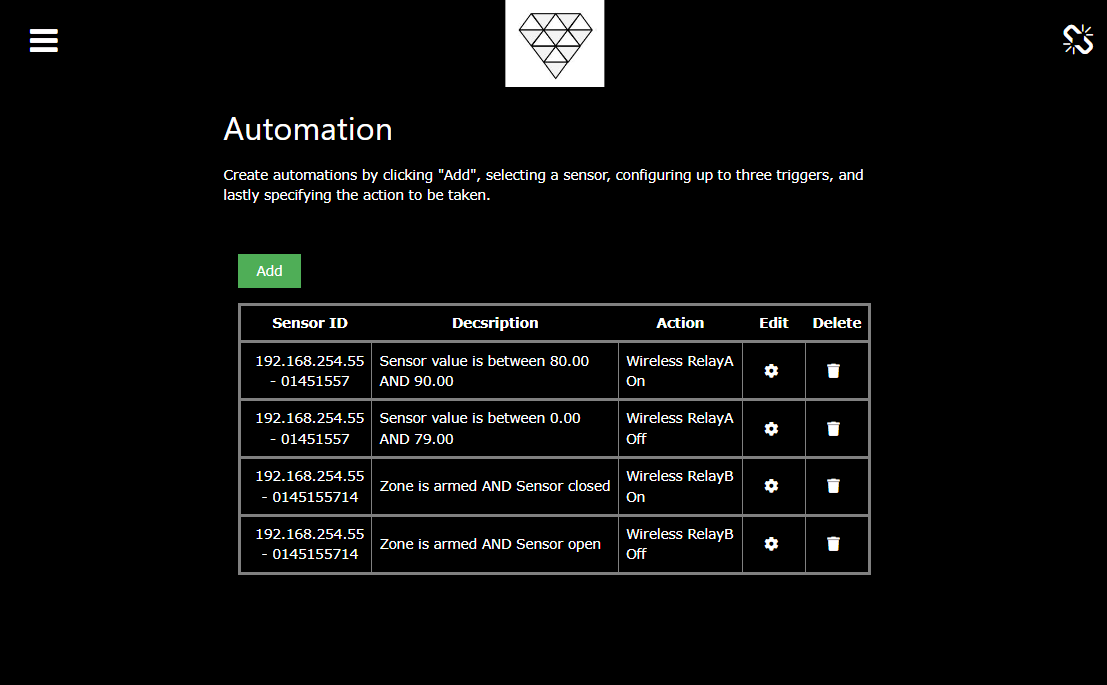
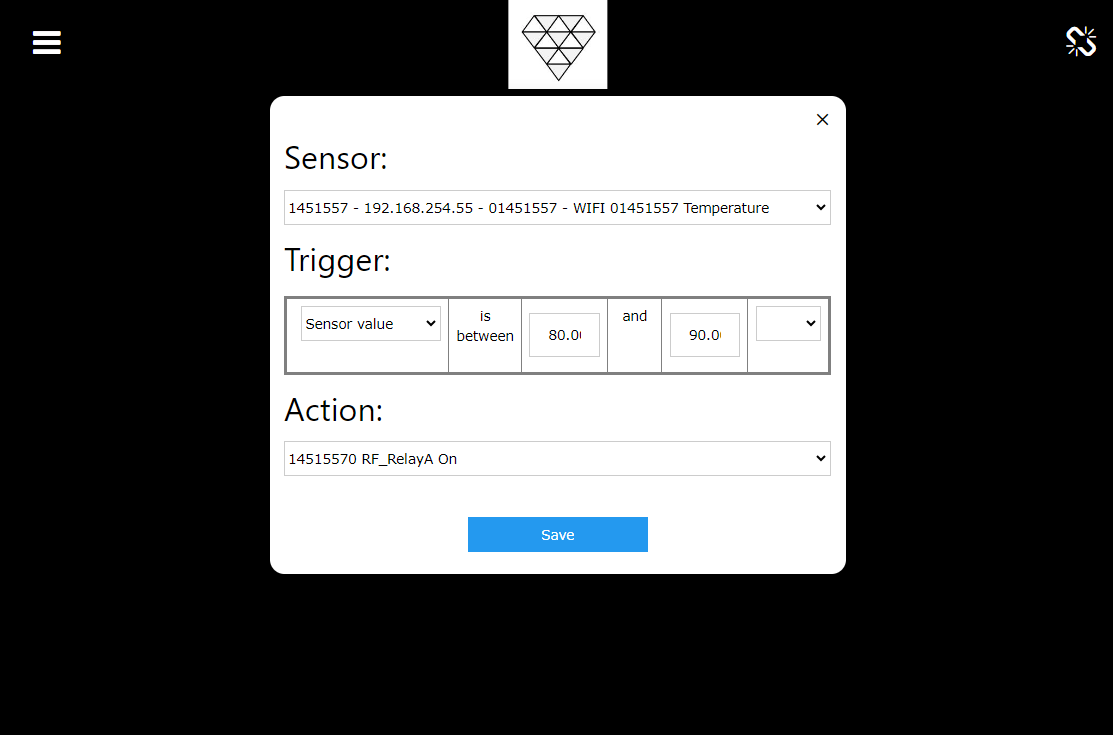
Rules (Automation)
Using our sophisticated rules engine you can create rules that are processed in real time to create alerts tailored to your needs. You use parameters like sensor values, time of day, days of week, alarm activated/deactivated to define rules specific to individual sensors. The rules can alert you to specific events like a door being opened, motion being detected or temperature or humidity reaching a threshold. You can also use the rules to determine if something hasn’t happened. For example you may want to know if no motion has been detected for a time period (popular for monitoring the elderly). Or you may want to know if your garage door was not closed. You can also apply a delay setting to a rule that will only trigger after the rule if valid for a period of time (e.g. garage door open for more than 5 minutes). This is also useful for monitoring the temperature of your house or a fridge where you only want to be alerted after a sustained temperature drop or increase.